Generate customizable graphs (as in graph theory) and download them as an image. Implemented as a Progressive Web App (PWA).
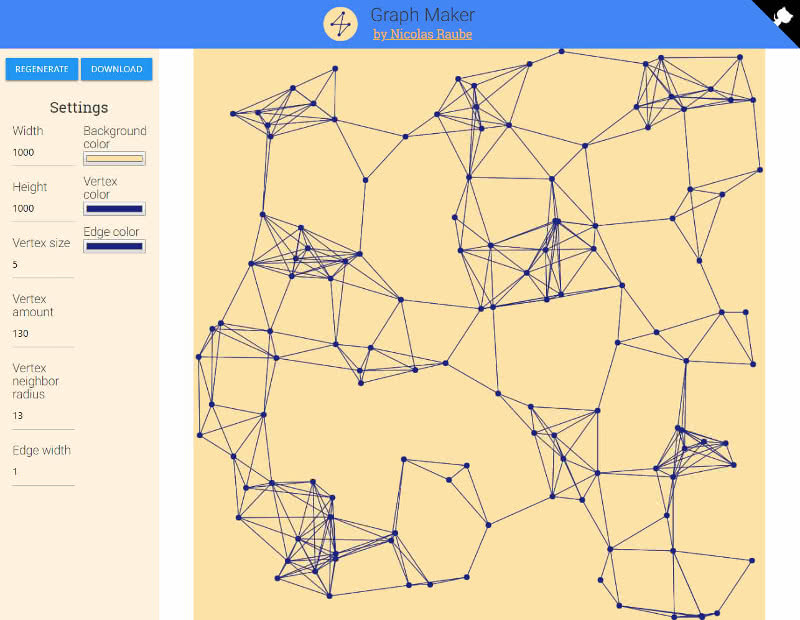
Table of contents
Building the site
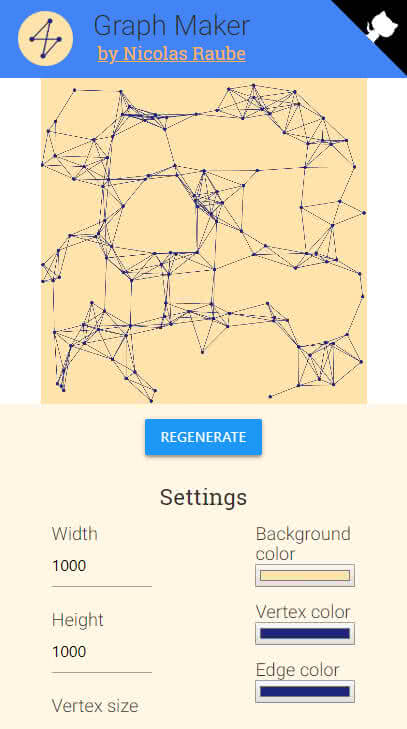
I already had the logic figured out in the pen which wasn’t very complex anyway. The biggest challenge was to make the site responsive (looking good on every screen size).
The two-column settings should turn into one column at a width that is too small and at an even smaller width the settings should move to the bottom. The canvas also had to fit the screen width regardless of the size of the canvas which wasn’t that easy to implement because it can have any size you want and it has to remain its ratio after resizing the window. You can have a look at the function that calculates the canvas size and of course all other code on GitHub.
Turning the site into a PWA was a no-brainer as I was already dealing with the topic for a long time.
Download image
At first, I used data URLs to download the canvas as an image but as Chrome dropped support for top-frame navigation, I needed to tell the user he/she has to right click and select ‘Save image as…’ to download the canvas as an image.
Main functionality
The site is loaded with default settings that the user can obviously change. He/she is able to control the canvas size, the vertex (point) size, how many vertices there are, at which distance two vertices are considered a neighbor and thus connected, how thick the connecting edges are and colors.
What I learned
- How to keep a canvas responsive respecting the resolution, size and maximum size it can have.
- How to implement a PWA
My favorite thing about this project is
that the design is as responsive to the screen size as it is.
Conclusion
It was fun to build and I learned something like in every other project, but what really was a please was coming back to the code after one year and finding it easy to turn everything into a PWA.